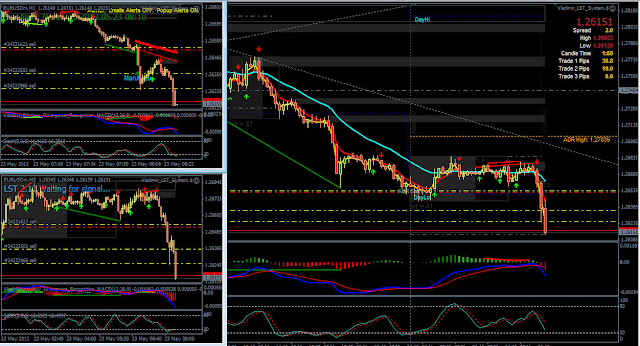
The charts below are Short trading on GBPUSD and EURUSD on May 23rd (177 Pips).
Trading intra-days in the Market Maker's Trend structure being alert of Red-flag news release has been making me aware of "The Calm before a Storm". Luckily the flow of the Storm is mostly to complete Market Maker's pattern (as Steve Mauro states in his MMM course).
Trading intra-days in the Market Maker's Trend structure being alert of Red-flag news release has been making me aware of "The Calm before a Storm". Luckily the flow of the Storm is mostly to complete Market Maker's pattern (as Steve Mauro states in his MMM course).
See this Chart:


Signal to go Short was triggered by LST system. FMM has also showing an Exaggerated Stochastic Divergence.
I began to realize that the price would be usually calm in a tight range preceding the Red-flag news on GBP to be released 30' minutes after London open. Price was initially moving down gradually then made a spike down taking out the initial TP 50 Pips to fulfill the Market Maker's move (50, 33, 20, 11 = 114 Pips).
Seeing the correlation between the Red-flag news release and the price move would make traders capable of predicting when the Intra-day's price move would take place.
While the Red-flag news impact GBP, since EURUSD 80 % correlated to GBPUSD, then it's not uncommon that EURUSD move along the spike since bearish move of GBPUSD, Currency strengthperspective, could be result of:
1. GBP weakening or,
2. USD strengthening or,
3. Both
So 2 out of 3 occasion the EURUSD would move along. See this short on EURUSD nearly the same time triggered by LST (36, 19, 8 = 63 Pips).

Could you please explain your detailed decision making process for these three GBPUSD short trades? What I can see from the 1m, 5m, and 15m charts is that LST was giving bullish signals.
ReplyDeleteAlso, the 1m chart indicates a Marubozu pattern. But I don't see it.
Thank you!
Well, this situation was actually influenced by the critical area where the EURUSD was at.
Deleteplease see divergence from the perspective of Buy - Seller, Supply - Demand. I have explored how the divergence developed in my post (forgot which one), that divergence measure the growing and fading momentum. In certain aspect it is a depict of Price Action reading of Strength and Momentum as taught in YTC-PAT.
Therefore, divergence doesn't dictate a trend reversal. Yet reversal most of the time preceded by a slowing momentum and strength in certain level. But its the price it self (buy-seller) who dictate the reversal. That's why a price confirmation required to take the signal alerted by LST.
It is why during the strong Trend the price could diverge several time before actually reverse. It might be retrace a little but not a reversal.
Short of GBPUSD in the first 2 picture above involving several consideration as it is 80% correlated to EURUSD on pic 3 so I would drag you to Pic-3 first.
There was a Demand area created on August 24th 2010. This Demand area has rejected the price up on Jan 13rd 2012 then again on May 18th 2012 but the price was not rejected as strong as it was. See EURUSD on your chart and draw Demand area.
On May 22nd EURUSD began to penetrate just a little the upper boundary of a Demand area. The Demand area was a little bit wide. So I was reluctant to go short and expecting a Bullish divergence. I was expecting the price bounced strongly bit it didn't. Instead, price go sideways but I know it's waiting for News Release. Finally a Bearish Divergence emerged but I didn't take it at the top as usual as I aware that I am on top of a Demand area. Only Novice would sell into such a huge Supply area.
Instead, I waited for FMM confirmation (MA Cross or Stoc Cross). Since the sign was strong I thought that the price might penetrate the Demand area a little but further then would be fueled by News.I took the short
after several confirmation and after the break of the previous swing low and scale in 2 times at trend resume (see chart M1). This move was bounced by the lower edge of Demand area.
During the strong move down indeed M1 made a bullish signal but I didn't take signal of LST on M1 especially if against M15 setup. I use M1 for Price Action reading. I only took M1 signal for precise entry if align of trigger M15 setup. The situation above was a Bearish move. This would be valid until a Bullish setup emerged on the other direction (Lesson from FMM).
TBC ...
If I was waiting for a precise entry for an M15 (ex. Bearish setup) setup then an alert emerged on M1 align with the M15 setup I would be waiting for a re-test/retrace since LST's trade trigger would be about 10 pips of the high. If this retrace failed to take out the initial high then I would enter the short.
DeleteBut on M1 there would be several Price Action trading sign more than candle pattern could alert. All of them showing reversal, failed test, failed to continue, strong/lack of follow trough etc. This is how a machine would never beat a "Trained Eye".
I might remove LST's EA from M1 charts if created more confusion than help.
But during my observation the signal of LST on M1 took out its 1st TP most of the time but comparing to candle size it was mostly just 1:1 RR between 10 - 12 Pips. I don't want to chase such move.
EURUSD and GBPUSG are 80% correlated so they would never be against.
On the first 2 picture of GBPUSD there is the same Demand area treated the same by GBPUSD. Its Demand area created on Jan 12nd but until May 22nd this Demand area haven't been re-touch.
At the time when EURUSD first touch its Demand area on 22nd GBPUSD still away from its Demand area (could be one more day move down). From the Supply and Demand perspective there have been no barrier fro GBPUSD to move down. Its began to crawl around its Demand area today on May 25th.
Price could reverse up at this point or break down to area 1.21900-GBPUSD and 1.53000 EURUSD. But this is a broad situation while we act micro on Daily trade. Yet we'll be watching the price today and next Monday.
So there were a contrary of expectation so I would wait the market to show me. Bearish divergence triggered right on the upper trend line (LST & FMM). If only I didn't aware of EURUSD situation I would take the Short right at the failed test to Trend line and failed to break the upper Asian Box (sometimes Session Box specially Asian Box is a strong Support and Resistance) at the same Bearish trigger on EURUSD that I passed also.
Additionally LST later alert a Bullish Setup so I waited more which setup win despite the strong sign of Bearish move: Failed break of Upper trend line, MA cross strategy of Ed Burke also suggesting Short.
Russ Horn taught that he has seen in years the Trend Line still Hold even all the technical analysis to go through. So he put extra emphasize on Trend Line.
I took 1 short (1 bar before London open) after price broke down the swing of Bullish Divergence Green line knowing that This Move would be fueled by news 30' after London open. This first order was take out by the news for 50 Pips. Additional 3 scale in later closed manually.
This comment has been removed by the author.
ReplyDeleteCorrection, As noticed by Kelvin, the DEMAND area for GBPUSD was not on Jan 12nd but on March 12nd
Delete