Possible longtime Setup on GbpNzd pairs, unless the price broke down the lower channel:
The chart above shown the GbpNzd forex pair daily chart.
Analysis:
1. Price has broken up through the upper channel line with huge volume then retrace back to test the low. The price has been in a flag form correction for several days that finally broke out for about 500 pips. Price has been in consolidation that accumulates huge size. No wonder the break out was huge.
2. The bullish move was preceded by a stop hunt to the low (bear trap) to grab liquidity. Normally, such stop hunt preceding a bullish move lasted for several bars.
3. Price is sitting on the lower upsloping channel. Unless the price break down the channel line, the bias is bullish.
4. The initial bullish move was pushed by a huge volume, while the pullback was with lover volume (The volume spread analysis in lower time frame displays series of stopping volume at the latter bars of some swing lows). These were signs of the weak in bear and strength of bull move.
I will look for a bottom formation, reversal formation, then a pullback to test the low. I will look for a buy set up in the lower timeframe, 1 hour, 30 Minutes, and 15 Minutes.
If you would like to see the full analysis:
http://www.4xmagz.com/gbpnzd-possible-longtime-bullish-setup-600-pips-dec-18th-2019/
Tuesday, December 17, 2019
Possible longtime setup GbpNzd 600 pips potential
Tuesday, March 14, 2017
Prepare to Long Eur Jpy for a possible 218 Pips move
Forex Trading Signal on Eur Jpy 4 Hour time frame; prepare to long at the proper price level.
As mention in the previous post;
http://www.fxmags.com/trading-signal-possible-170-pips-pulback-eurjpy/
the price did went as scenario 2 and made a nice pullback for more than 100 pips. It is a good time to now anticipate EurJpy to complete its 5th wave for about 218 pips movement.
Read the full analysis in the link below:
http://www.fxmags.com/trading-signal-anticipate-eurjpy-218-pips-bullish-rally/
As mention in the previous post;
http://www.fxmags.com/trading-signal-possible-170-pips-pulback-eurjpy/
the price did went as scenario 2 and made a nice pullback for more than 100 pips. It is a good time to now anticipate EurJpy to complete its 5th wave for about 218 pips movement.
Read the full analysis in the link below:
http://www.fxmags.com/trading-signal-anticipate-eurjpy-218-pips-bullish-rally/
A possible 100 - 170 pips pullback on Eur Jpy 4 Hour timeframe
In the previous post we anticipate the trading signal for a possible 500 pips bullish rally in Euro Yen pair to complete its 5th wave (1 Day timeframe), yet I warned that it might have 2 scenarios. We apparently run in to the second scenario. Read it again to be aware of the situation:
https://trading-price-action.blogspot.co.id/2017/03/forex-trading-signal-eurjpy-projected.html
Obviously, this 5th wave is just the 1st wave in the smaller timeframe (4 Hour), which has just completing its 5th wave in even smaller timeframe (1 Hour). I was convinced that there will be a sufficient pullback move to be trade: a signal for probably 100 - 170 pips pullback to at least 0.50 or 0.61 fibonacci retracement level.
I did take the short after the bullish momentum appear on the bearish flag (15 Minutes timeframe), but I exit at the lower channel for 40 pips since it is already lae in my timezone.
The full analysis is here:
http://www.fxmags.com/trading-signal-possible-170-pips-pulback-eurjpy/
Forex Trading Signal; EurJpy projected for 500 Pips bullish rally
On EurJpy pair this week, a trading signal is projected for about 500 Pips bullish rally to complete its 5th Elliot-wave move in daily time-frame bullish channel. This move might last for 2 - 3 weeks so please do your price action analysis to take a proper entry and management. Please bare in mind that this is a high probability move only. There is no guarantee that the price will move to a certain direction. We are only anticipate the move and when the price confirm it, we take the trade.
Please also remember hat even tough the eventually get there, it moves in waves.
Please read the complete analysis; situation, probable scenarios, how to trade it in the link provided below:
http://www.fxmags.com/eurjpy-projected-500-pips-bullish/
Tuesday, August 13, 2013
Quick profit, Scalping the pullback
This is an example of a quick profit scalping the pullback, integrating the Supply and Demand, Divergence Trading, YTC PAT, Candle Pattern and Bollinger Band. They were all align, expert4x would call it WATO (With All The Odd).
The price move on M1 Chart (19 Pips):
Price Action on M5 Chart:
Cycle-2; At the same time it create two hammer on M5 chart.
Cyrcle-4; Stochastic made bullish divergence
So I place 1 buy after a break of a trend line on M1, SL just right under the pin bar (about 10 pips) and TP right under the Supply area on M1 chart. SL later move to the 2nd last pullback.
Cyrcle-3; Price reach right exactly in to the TP for 19 Pips then lazily resume bearish. This is the power of Supply and Demand.
The price move on M1 Chart (19 Pips):
Price Action on M5 Chart:
Above picture; Right is H1 and Left is M15
Reading the price action we could see that the current bearish move is the 4th wave (elliot wave), this could travel until the Resistance - 1 or Resistance - 2 (two green dash lines strike through the middle of the 3rd wave)
Above picture; Right is M5 and Left is M1
Cyrcle-1; Just right above the Resistance - 2 on H1 chart is a Demand Area on M1 Chart and right on Bollinger Band. Analyze using YTC PAT and its clearly seen the momentum slowing down (slope of the candle, deep of pullback) then a failed test to the lowest pointCycle-2; At the same time it create two hammer on M5 chart.
Cyrcle-4; Stochastic made bullish divergence
So I place 1 buy after a break of a trend line on M1, SL just right under the pin bar (about 10 pips) and TP right under the Supply area on M1 chart. SL later move to the 2nd last pullback.
Cyrcle-3; Price reach right exactly in to the TP for 19 Pips then lazily resume bearish. This is the power of Supply and Demand.
Sunday, June 10, 2012
Trading Corrective Move - a cristal clear setup
Since last week I have been visualizing the future price move to be intra-week bullish (YTC PAT teach how to visualize the future price move)
Please Notice that the link on these page would lead you to FMM, LST, YTC-PAT and Trend Collapse official page as asked by the author. Yet the systems are available free in Indo-investasi as well as other thread anyway. Legal or illegal depend on your respective stand.
On the last paragraph of the post:
Please Notice that the link on these page would lead you to FMM, LST, YTC-PAT and Trend Collapse official page as asked by the author. Yet the systems are available free in Indo-investasi as well as other thread anyway. Legal or illegal depend on your respective stand.
On the last paragraph of the post:
http://trading-price-action.blogspot.com/2012/06/1671-pips-on-june-1st-creative.html
I've been expecting both GBPUSD and EURUSD to have an intra-week bullish move.
"But seeing the M15 chart I was thinking of a short term future price
visualization for the next week. Base on the large pile of Buy at this
demand area, next Monday i would expect an intra-week bullish move that
preceded by a stop hunt low to test the low, straight long trade, or a
gap-up price then fill the gap to test the low. Here is where LST and FMM (Klik the link if you aren't familiar with it) play their part but we already know what to expect. Lets see them
prove themselves."
They were indeed bullish:
EURUSD H1 (240 Pips Weekly Range):
GBPUSD H1 (270 Pips Weekly Range):
And the bearish move on Thursday - Friday has also been pre-analyze. Look at the comment on the above mentioned post.
"Since the early week Both EURUSD and GBPUSD indeed move bullish as have
been visualized (Monday up, Tuesday correction, Wednesday Up)
As of June 6th, end of US session EURUSD halted by Supply Area while GBPUSD has been halted before US session and made choppy topping formation.
On D1 EueUsd has seen a potential Bearish hidden divergence, means if tomorrow the price reverse down then it would be a bearish resume of a D1 bear.
Align with D1, both H4 and H1 has also showing a potential Bearish Regular divergence, means if the price reverse down then it would be a reversal for H4 and H1
While on M15, EurUsd made a last thrust and halted by a Supply area. If tomorrow M15 reverse down then it would validate the premises for H1, H4 and D1.
Price must turn Bearish around this point to validate the divergence state. Otherwise, if a sentiment occurred and pulled price up that also pulled the divergence away then the divergence setup would be invalidated since H1 H4 and D1 is just a potential divergence, not valid yet.
But seeing all aspect aligned I am strongly believe that my premises would be true.
Remember though, anything could happen. Lets see the market reveal it self."
As of June 6th, end of US session EURUSD halted by Supply Area while GBPUSD has been halted before US session and made choppy topping formation.
On D1 EueUsd has seen a potential Bearish hidden divergence, means if tomorrow the price reverse down then it would be a bearish resume of a D1 bear.
Align with D1, both H4 and H1 has also showing a potential Bearish Regular divergence, means if the price reverse down then it would be a reversal for H4 and H1
While on M15, EurUsd made a last thrust and halted by a Supply area. If tomorrow M15 reverse down then it would validate the premises for H1, H4 and D1.
Price must turn Bearish around this point to validate the divergence state. Otherwise, if a sentiment occurred and pulled price up that also pulled the divergence away then the divergence setup would be invalidated since H1 H4 and D1 is just a potential divergence, not valid yet.
But seeing all aspect aligned I am strongly believe that my premises would be true.
Remember though, anything could happen. Lets see the market reveal it self."
And:
"GbpUsd has also showing the same state but the sign on EurUsd were
clearer. Tomorrow might be what Steve Mauro called a Mid - Week reversal"
They were indeed reversed down for 180 Pips (EURUSD) and 200 Pips (GBPUSD).
But even both pairs bullish it doesn't mean there would be no short opportunity. At least there were 2 short opportunity along the way when the price made corrective on both EURUSD and GBPUSD.
Well, do not mind about the pips gain (but if you curious zoom the top right hand side to the real time pips gain indicator and count your self). I don't want anyone called me boasting my Pips gain anymore. I was thinking that the Pips gain shown by the indicator on the top right chart was enough.
The point here is, during a bullish move there would be a corrective and the corrective move will always steep like a falling rock, but it must be seek carefully.
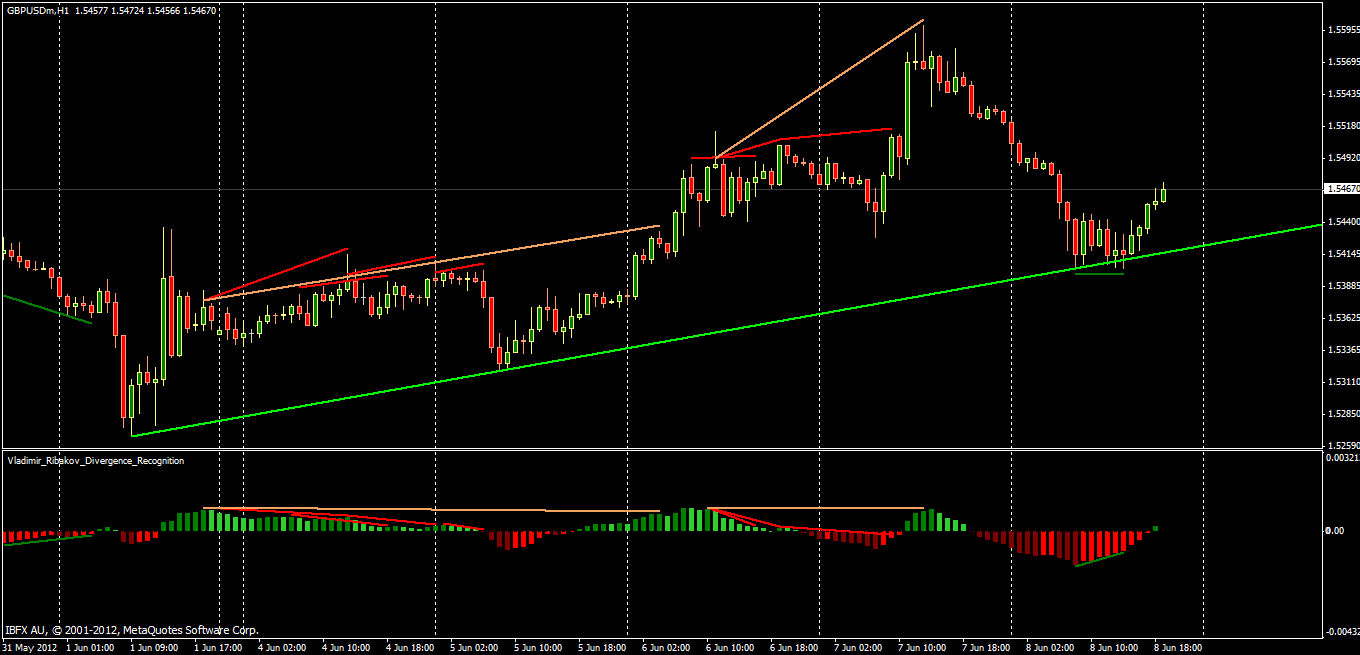
As I have always said, during a strong trend the price would diverge several time before actually reverse. The price were rejected by a SUPPLY area created on May 29. On MMM template it was two pins/shooting star to the blue/yesterday high and S1 at the same place. Yet I took the first short after the price broke down the Trend Line the back to test the broken trend line with the second pin (Hector's - Free Trend Collapse).
Steve Mauro might call this a CRYSTAL CLEAR SETUP but he failed to make it clear to his student. Newbie of MMM would try to catch all the M/W formation thinking that he/she caught the top/bottom.
Vladimir would have probably did the same thing. He put less explanation on the confirmation required after a Divergence setup emerged. He only said that any familiar clarification would be required. Anything that the user familiar with such as Trend Line and Support/Resistance. He put less importance that this point is the difference between life and death.
See how many times divergence occurred yet no reversal. If trader rely the entry solely on divergence they would wipe their account.
"Divergence should only be treated as SETUP while ENTRY should not be taken based on divergence but by the PRICE it self"
On the other hand Russ Horn's Forex Master Method did a better job to give teaching on divergence knowledge.
On EURUSD trade above, I was tighten my stop right above the ADR low (Thick red line) but as I see a second failed test to the DEMAND area I exit all position and wait for a retrace to have re entry.
It was a hidden bearish divergence by Stochastic so I enter 2 units, about 5 to 9 Pips of the high. The stop was above the swing high but as a see candle close with a hammer and a potential regular bullish divergence on Stoc I tightend the stop (see the red dashed line, the picture taken while the second stop haven't been moved). The stop was hit by -1 and -2 Pips.
SEE,,, Why still anyone accused me of hiding my loosing trade. I've shown some of the loosing trade. Just like the following trade:
As have been spotted, it was a Regular Bullish divergence so I enter 2 units on the second failed attempt to test the low that leave the second Hammer. New trader should have not done this unless understand the price action.
See M1 chart for better Price Action reading. Additional 1 unit long when the price took off and broke the trend line (it is the safest entry). Later I did a stupid mistake breaking my own rule "Never chasing the price". The last green bar on M15 was a quick move. I jumped in with 1 unit long just later to see the price action on M1.
Look at the three pins to the high. That told me that the move up is going to failed. I was aware that the bullish divergence was still valid and nothing to halt the price to move up. If only I hadn't enter the last Long I would still hold the stop under the swing low of M15 and I would not have adjusted my stop to the last swing low of M1.
The stop was to tight. The price just move lower than the swing low of M1 chart by 1 Pip, just to take out my stop then move up nicely, as Steve Mauro called "BACK INTO THE RANGE", for about 50 Pips.
I was stopped out for about 10, 9, 5 and -13 Pips. See that,,, it was a loosing trade but still small profit.
The same situation also on GBPUSD, June 5th but i didn't take any trade since GBPUSD was move wildly:
Another trading on Corrective move also spotted on June 6th, EURUSD and GBPUSD:
See that all the teaching material (Price action, YTC PAT, Al Brooks, Vladimir's LST, Sam Seiden Supply and Demand, Steve Mauro's MMM, Russ Horns's FMM, etc) work hand in hand in trading.
Sunday, June 03, 2012
1,671 Pips on June 1st - Creative Accounting..???
This would be a long
lesson about the Difference between "Scale - In"
from "Creative Account" and broad market analysis that lead me to maximize the potential gain.
From the perspective
of Money - Gained and Money - Risked, creative account and Scale - in technique
is completely different. They are nearly opposite in my opinion.
Why...? With creative account you multiply the PIPS
and MONEY risked while with scale - in you multiply the MONEY and the PIPS
gained. Creative account would split the initial entry to 10 or something just to jack-up number of pips gain as well
as pips risk at the same time, yet money risked and gained is just the same as
if the initial entry were not split. This maybe done just to impress readers
for pips gain.
On the other hand
Scale in entry split the initial entry for Money Management to ensure a
winning position if price later go against the trade while preparing to ride
the move if price go in our trade (Please spend time learn and apply YTC-PAT's
the importance of exit strategy and
Trading in the Zone for this point). The next scale in would be a safe trade at
all. Look at my post on 203 Pips on May 30 Apr. The step explain clearly how
the stop adjusted at every step of the scale in. A wrong trade/loosing trade
might occur but no money would lost.
While scale in
taught by Steve Mauro's MMM could be just nearly the same with the above
Creative Account. It's like betting with all your money assuming that you know
where exactly the market is heading while "Trading in The Zone" is
totally correct "ANYTHING COULD HAPPEN". That's why I REFINED this
Scale - in Scale - out incorporating the most powerful "entry-exit Money
management" taught by YTC - PAT and Trading in the Zone (some still ask
what YTC-PAT is, it is Your Trading Coach - Price Action Trading, by Lance
Begs).
Followings are trade
on June 1st, GBPJPY and GBPUSD. They are example of what so called
"Creative Account". I could have just split my initial entry to 2 or
3 units instead of split to 7 units. The pips gain would surely impress you
all. If only I scaled in along the way i would double that pips.
I could have gain
more than 1.671 Pips trading back and forth if I were not exited too soon in
some exit.
But the most
important lesson in the above post is the PER-ANALYSIS of TREND STRUCTURE that
lead us to the move that we exploited (a rally in to the bottom - a strong
spike bounce then Re-test of the Low) that result 1.671 Pips gain.
I have explained
this situation in the last 2 post that GBPUSD and EURUSD is heading toward a
very strong DEMAND area.
GBPUSD, D1 May 31st:
The picture above is
Daily chart of GBPUSD on May 31st, it was halted by a channel line. You'll
notice the 3 thicker gray lines I drew. Look at the top lines. It was the
situation that I explained in the comment of my post "The CALM before
STORM" where GBPUSD was halted by a Demand area while EURUSD has been over
shot its Demand area. So I was tent to believe that both GBPUSD and EURUSD
would go for their next lower Demand area.
The middle and
lowest lines is the demand area I drew manually. From this point there are no
barriers to halt GBPUSD to test its Demand area. Sam Seiden would say it would
be only Novice who's going to sell in to such strong Demand area. But Sam
Seiden also say that, since professionals need novice to buy from, a strong bearish move in to the Demand would
often created to create believe that price is strongly falling.
So I would expect a straight trade instead of
a pullback/stop-hunt to the high. I noticed that there is still more than 150
Pips to be exploited. But I also need to
be extra careful to watch the reversal sign. Look to the left and apply odd
enhancer. The price was leaving the area strongly strongly and leaving a pin.
Samething is going to happen on June 1st. The price would aggressively penetrate
and reject by this area leaving a pin. And if there would be a strong rejection I would wait for the price to test the low for a long opportunity.
So, as
taught by YTC-PAT, I would visualize the movement tomorrow would be a strong bearish move - bullish rejection -
retest of the low. Anyway, as Trading in the Zone taught, ANYTHING COULD
HAPPEN. So I would evaluate the sign in every step whether my premises are
validated or in-validated.
GBPJPY, D1 May 31st:
This is the Daily
chart of GBPJPY on May 31st. Price was halt by a Demand area but it was not a
strong Demand area. Besides, we have two long low close bear candle. Both Al
brooks and YTC-PAT would suggest a break through. Additionally, I would target
the trend line as well. GBPJPY has more than 200 Pips to be exploited. Having
this pre-trading analysis, I was ready for the trade next day. So, tomorrow I
would expect a Short trade that could be preceded by a stop hunt to the high or
just a Straight Short Trade.
Look how I exploited
the market based on my future price visualization. Following are trade that I
took. Just to remind, yellow lines are entry lines while red lines are Stop
loss.
GBPJPY, June 1st:
I placed 3 units
short after Asian box. Price was reluctant to go up. There were no divergence line by LST as it was not an
extreme area but it was a hidden
divergence following by a stoc cross. I got no time to scaled in since the
shorts were placed while at office then rushed home while the price made a
strong bearish move.
Look how I neglected
the Bullish Divergence line drew by LST as I realized that we are on a strong
bearish move. I have stated many times that during a strong move the price
might diverge several times before reverse. Thus we need price action
confirmation to take the trade. Look how price action are over all of any
indicator. Though, I anticipated any possibility by adjust my stop right under
the lowest entry line which was never
been touched.
The trade exited
after the chart made a hammer for 126, 121, 112 Pips.
GBPUSD, June 1st
Something was wrong,
I could not place further entry on GBPUSD. I was being rejected all the time
and finally managed to place 2 shorts on GBPUSD. The trade exited for 31 and 26
Pips.
Image3a.jpg
GBPJPY made a
retrace. There were a divergence line by LST. I took long trades after a failed
test low but it wasn't looks like a
strong pullback. The trades were scratch for small profit when the chart
showing a bearish hidden divergence. I was reluctant to go short anticipating
the move has over. I didn't take the short at the pins as usual but I waited
for confirmations. I didn't even take
short after the stoc cross down until the yellow MA crossed down. I witnessed
that the price still away from its channel lines and there were no "Last
Thrust/Volume climax" yet. I also realise that news is coming. The big
move is imminent, I was aggressively place 5 shorts on GBPJPY and 2 Shorts on
GBPUSD. I was excited to know this situation (Russ Horn would say: I feel like
I am cheating). This is the emotional situation that I would not recommend.
Price indeed made I spike low fueled by the news. See, Steve Mauro said that Market
makers use News to complete the MM pattern.
I knew that this move will create a pin so I exited at the first pause
for 75, 75, 75, 78, 78 Pips.
GBPUSD.
Same situation on
GBPUSD. Exited at Demand area for 26 and 28 Pips. This bar is a news bar that
later turn to long pins.
Image5a.jpg
As I have visualized, the price were wild around the Demand area. The Market Maker indeed
create this move. Professional were buying at this area that create such
massive moves. We'll compare this picture behavior with the picture from
previous Demand area and asses if this
is going to be trend reversal. GBPJPY was moving wilder that gave me no time to
make decision. I was able to take a decision after GBPUSD made two pins to the
low. I placed 7 Long trades aimed for the above Supply area. This is a mistake
that made me exit too soon. I should only tighten my Stop in this situation.
The price made more that 130 Pips while I exited around 70 (68, 68, 67, 67, 67,
68, 68)
Image9a.jpg
Image9b.jpg
Price indeed reach
its upper channel. Look at Daily Chart. I have said several times that Pins on
S/R or SupDem would 80% of the time being tested so I place 7 units Short when
the price action told. Look at the price behavior on M1 and M5 where I place the
short and stoc divergence and cros on M15.
Again the trade
exited too soon for 50, 48, 48, 47, 50, 51, 48 while price still reach the aqua
line.
GBPUSD-D1
Now look st this GBPUSD - D1 chart. Its a pin to Demand area. Lets visualize the future movement. The price was strongly rejected in this area compare to the upper Demand area. See it in M15 chart. This strong rejection could be a start of a bullish trend.
But Look it in Weekly chart:
GU-W1:
It was a low close bear candle. Look to the left, this demand area have rejected GBPUSD up four times. Yet the price took process to reverse, learn the candle form. The price might reverses up from this point but could also just a retrace for a larger bear move (could take 1 week to develop). If price would broke the Demand area then there would be more than 10.000 Pips to the next Demand area.
Which one would happen...??? we don't know anything yet. We'll see the price developed and act accordingly. Remember, this is what we call: THINK GLOBALLY, ACT LOCALLY.
But seeing the M15 chart I was thinking of a short term future price visualization for the next week. Base on the large pile of Buy at this demand area, next Monday i would expect an intra-week bullish move that preceded by a stop hunt low to test the low, straight long trade, or a gap-up price then fill the gap to test the low. Here is where LST and FMM play their part but we already know what to expect. Lets see them prove themselves.
Sunday, May 27, 2012
1.748 Pips Gain in a full week trading
I posted the trade on May 21st to complete the whole week trading post. Unluckily I have to spend my weekend to prepare 2 post including this one.
GBPUSD: 10, 44, 32,
30, 18, 9, -3, 27, 19, 17, 16 = 219 Pips
EURUSD: 19, 19, 0,
20, 16, 1, 1 = 73 Pips
Total: 292 Pips
The total
Pips gain this full week trading:
May 21st : 292 Pips
Total: 1.748 Pips
Finally, this post
on the trade May 21st - 2012 would complete the trade for the whole week five
days. You will see the wrong trade just like the other post. Learn the
situation when I loss -3 Pips on GBPUSD and several trades of EURUSD that I
scratched and scratched. If I were loosing focus and wasn't read bar by bar
price I would have given back some of my profit to the market. This wrong trade
would be a huge loss if dealt differently.
Some of the trade on
EURUSD I would call a wrong trade since they were not move in my favor as
expected. I know that a member forum say that I spent a
lot of chart time. Indeed but look at the gain. I know that many traders still
expecting a stress free trade, set and forget trade. Tell me if you were not
stress when your stop keep being hit and you lose money. On the other hand I could
have close the wrong trade in profit without waiting for the price hit my stop.
You might think that those would be just a small profit, then read my post on
trade may 24th, it was accumulated more than 300 Pips.
It was Lance Begs
YTC-PAT taught me this. So I would directing traders to his site as he
requested in return of his kindness to share his knowledge. (Although I know
that Indo-investasi forum provide the link for free). It was YTC-PAT taught me
to trade Dual monitor (Next week would be three screen, I have to order another
screen and usb to vga adapter from the capital of Indonesia as I am currently
at the very remote small island for a tour of duty), have higher and lower
time frame chart, trade evaluation, rehearsal
etc. But Lance Begs apply it on the Support and Resistance line while
for me at the Supply and Demand area. Again I should also thank Sam Seiden for this
Great share of knowledge.
Still some criticize
people that giving a good sharing: why would they sell system if they really
making money with their system. I also aware that my way of providing real time chart
and pips gain as indicator show at stage to stage is still not enough (instead
of showing complete chart and an empty
claim that I made more than 800 Pips during this move).
I believe they are doing this not for money.
Some people doing things not for money. Some enjoy teaching and sharing.
I will post the
trade on GBPUSD first, yet both trades on GBPUSD and EURUSD were taken nearly
the same time. You may notice that in this picture the Divergence line of LST
System (still in the forum some asked what LST is, it is Forex LST System ofVladimir Ribakov) were missing as the picture taken today on May 27th.
This is the picture
of complete move GBPUSD M15 on May 21st:
Pic-1:
H1 chart (not shown
here) has shown indication that the correction on the large bearish move has
ended. There were a fading of bull strength and the price has been rejected
several times by a Ceiling (yellow circle). I was a little bit late to open the
computer so I miss the trade at the end of Asian box. I took the first trade at the last circle
when price made two Pins to the high
Pic-2:
LST has showing
Regular Bearish Divergence. Look at the
chart M-1 (top left), price rejected by blue line (MMM). I enter 2 initial
units. First TP above the next Demand area. The first move down just miss my
first TP then price show a rejection and failed test on M5 chart (lower left). Anticipating a deep pullback I adjust the SL of
1st TP 4 pips above the last swing high on M1 while the second unit's SL under the entry lines.
This stage I am already in the safe ride.
Pic-03:
It was this Pin that
took out the SL of the first initial entry for about 10 Pips. Look at the M1
(top left chart). Two consecutive high close bullish bar failed to take out its
initial High. David Weis would call this "Lack of Follow Through". I
scaled in 2 units short.
Pic-4:
Some scaled in after
each resume and finally the price halt by the DEMAND area (Please,, Please,,
Learn Sam Seiden Method, it works all the time). Look at the Chart
M1. Twice rejection, Lack of Followtrough and I was out. See the Pips gain
indicator on the top right. The last scale in was a loosing trade -3.4 Pips
loss. But am I lost any money ,,,???
Pic-5:
Later M15 chart, LST
trigger a long trade. I was in doubt as the price has over shot the Demand
area. Only after the third long pin that I enter 2 units Long.
Pic-6:
Price rallied up to
take out my first TP.
Pic-7:
At this stage both
LST histo and scto showing a potential Hidden Bearish divergence so I close the
second unit and be ready to revers the trade.
Pic-8:13
More than enough of
sign, I place 2 units short.
Pic-9:
Price fell of to
take my 1st TP. It's on top of a DEMAND area and already late in the night so I
close the second units then turned in.
Followings are
EURUSD trade, hope that the picture are self explanatory:
Complete move of
EURUSD on May 21st taken today on May 27th:
Pic-1:
This trade was
closed a little bit earlier when I saw a potential bullish divergence and a
quick rejection on M1 and M5 chart while price still made a last thrust for
more than 10 Pips and reached its ADR as seen on the next pic.
Pic-2:
This is again a
wrong decision. I doubt the Long singnal alerted by LST as the price halted
right at the Trend Line. I forgot that Trend line, SR, Supdem could Hold or
just Halt . That's how all aspect of analysis must come to mind all at once and
when some analysis seems conflicted the wrong decision are made. As my rule, I
should just move the Stop to BE. But as my premises were bearis, I doubt the
setup provided by LST. I refined this mistake in the days of trade next. Keep
refined and refined, all of them just "return to the rule", being
discipline, a willingness to do what I know I should do. See the next pic that the price resumed up in
to the Supply area.
Pic-3:
I placed 2 units
short when the price reversed down. I scratch this trade as I closed the trade
on GBPUSD, see the candle time and compare.
Saturday, May 26, 2012
314 Pips on May 24th - My LOOSING TRADE
The main mistake I made was didn't notice the huge divergence as LST wouldn't draw Divergence lines if not at the extreme area. This made me made wrong orientation and made some wrong trade that I scratch and scratch.
But WRONG doesn't always mean Loss pips. Still the result:
EURUSD: 21, 3, 25, 25, 3, 2, 2, 40, 32, 7 = 160 Pips
GBPUSD: 25, 25, 11, 4, 2, 2, 14, 13, 12, 16, 28, 2 = 154 Pips
I've been asked if I were had a loosing trade since all of the post only showing winning trade. I've answered that it depend on our respective perspective on how we define a loosing and a winning trade.
Most of traders would think that a loosing trade is loosing certain sum of money as the result of Risk and Reward ratio. Simply said when order placed with 1:2 reward ratio then price move against the trade and take the stop then it would be a loosing trade.
If the above perception were to be the base of Loosing Trade, then personally I have a better word to divine my loosing trade since I didn't always have to lose money if the market against me. Therefore I'd like to call it Wrong trade as I have many times mentioned in my post that my loss is small profit or rarely at Break even.
Lance Begs in his YTC-PAT has taught that reading Price Action bar by bar then there would be a certain point where an experienced trader would realize that he/she is at the wrong trade. He/she would define a certain point to define his/her edge where the price reach certain level then he would not be interested in the trade anymore and scratch the trade. Lance Begs rarely wait for his stop to be hit.
In this post I would provide what I called a Loosing Trade, Ooops I mean a wrong trade both EURUSD and GBPUSD consecutively. The similar scenario of loosing trade are also part of the post "471 Pips on May 25th". Read it if you haven't.
The chart below is the complete move of EURUSD on May 24th. Market Maker made a so called Stop Hunt Low by Market Makers Method after Asian Session then made a big correction then made the real bear move during last session of US. I made some wrong short trade during the stop hunt and the correction but I didn't lose money:
Pic-1, EURUSD complete move on May 24th:
But WRONG doesn't always mean Loss pips. Still the result:
EURUSD: 21, 3, 25, 25, 3, 2, 2, 40, 32, 7 = 160 Pips
GBPUSD: 25, 25, 11, 4, 2, 2, 14, 13, 12, 16, 28, 2 = 154 Pips
I've been asked if I were had a loosing trade since all of the post only showing winning trade. I've answered that it depend on our respective perspective on how we define a loosing and a winning trade.
Most of traders would think that a loosing trade is loosing certain sum of money as the result of Risk and Reward ratio. Simply said when order placed with 1:2 reward ratio then price move against the trade and take the stop then it would be a loosing trade.
If the above perception were to be the base of Loosing Trade, then personally I have a better word to divine my loosing trade since I didn't always have to lose money if the market against me. Therefore I'd like to call it Wrong trade as I have many times mentioned in my post that my loss is small profit or rarely at Break even.
Lance Begs in his YTC-PAT has taught that reading Price Action bar by bar then there would be a certain point where an experienced trader would realize that he/she is at the wrong trade. He/she would define a certain point to define his/her edge where the price reach certain level then he would not be interested in the trade anymore and scratch the trade. Lance Begs rarely wait for his stop to be hit.
In this post I would provide what I called a Loosing Trade, Ooops I mean a wrong trade both EURUSD and GBPUSD consecutively. The similar scenario of loosing trade are also part of the post "471 Pips on May 25th". Read it if you haven't.
The chart below is the complete move of EURUSD on May 24th. Market Maker made a so called Stop Hunt Low by Market Makers Method after Asian Session then made a big correction then made the real bear move during last session of US. I made some wrong short trade during the stop hunt and the correction but I didn't lose money:
Pic-1, EURUSD complete move on May 24th:
The main mistake I made was didn't realize the big Divergence as the result of my stress around the critical area when IBF* frozen the price for 1-2 minutes then giving burst by burst candle movement.
Pic-2:
Please read the comments on "The CALM before the STORM" to be aware the situation that EURUSD are sitting on a strong DEMAND area. See the price bounced three times and made a nice trend line.
I took two units WRONG Long trade when the price rejected up at the end of Asian box at the Bar of LST's divergence signal. Indeed I placed the Stop under Asian Box but I pay a close attention on the minor Supply area above and place the first TP slightly under the SUPPLY area.
The first TP was taken out for 21 Pips. Later when SUPPLY area rejecting price strongly (see Chart M1 - Top left) I was alerted. As YTC-PAT taught, if the price take over the last swing low that lead to the last swing high I would not be interested to the trade anymore and have to re-asses the trend.
The first move down didn't pass the last swing low but later reluctant to go higher. Later when the price pass down the swing low left I closed the the remain second unit for 3 Pips. I don't need to wait my Stop to be hit.
"Giving the market a room to breathe" should be applied prudently. So I re-asses the trend and began to realize that even EURUSD are sitting on top of a strong DEMAND area the sloping of bar series between swing was actually lean to bearish (see the dashed blue lines). The price could still pass down the low of 23rd and penetrate deeper in to DEMAND area.
I saw a growing bearish momentum on M1 (see the series of bar, red and green). I saw the potential Regular Bearish Divergence on both LST and FMM. LST drew the Divergence line after the red bar right of the shooting star closed. I confidently place 2 units short. My confident was growing as the price strongly broke the Trend Line.
Pic-3:
Later I add one more unit short but when price halt I exited all units considering that the DEMAND Area would hold.
Pic-4:
But later price still resumed (circle-1). I added 3 units short. This is a mistake. Some times I loosing focus and neglect my own rule. But again IBF* messed with me. I have always said in some of my post that prior to a sudden big move my broker would freeze the chart, re-quote as the internet connection were in trouble (I still could browse anyway). This one even worst, the circle-2 is not a price gap but chart frozen for 1 - 2 minutes and messed up the bar. The bar created from frozen to frozen. See the big green candle on M15 that later corrected to be a HAMMER (compare to the Pic-1). Maybe my broker already recognize me, how would I read bar by bar in this burst by burst move. I face this situation twice this week.
On the circle-2 the price already take out the last swing high that lead to the extreme low. But I had no chance to get out. Price frozen to frozen. It was at circle-3 that I managed to get out.
Note: This occurrence is not by un-intentionally. Read post by "Darkstar" on FF about how is forex market structured and you will accept this situation (same like Stop Hunt, re-quote, frozen etc) is the natural of Third tier Forex market. Its the mutual best practice the Market Maker could provide us among their limitation. We are treated differently by broker. We should not condemn the broker but embrace this natural circumstances instead and learn to dance in the rain. I recommended that you read the posts that have been bundled in to PDF.
Pic-5:
Price continue bullish and made another move down but I didn't get any sign of strong move. It was a last thrust, strong pull back and failed test that I enter 2 shorts and one more scale in. Exit the trader when the price halted at the Trend Line and Take out 1st entry.
It was later that I realized that I didn't notice the huge divergence on both GBPUSD and EURUSD that made me making the mistake after mistake then went sleep before the real bearish move.
Followings are GBPUSD trades that have the same Mistake situation as EURUSD. Hopefully the picture would self explanatory.
Pic-1, The move of GBPUSD on May 24th:
The Wrong trades:
Pic-2:
Pic-3:
Pic-4:
Pic-5:
These I called Wrong trade but will be a Loosing trade if I give the market more room to breathe and take out my Stop Loss.
As I have always said that reading price action correctly, the market would never instantly against you. Always take the 1st TP, re adjust the Stop of the second units and never let the winner turn to looser.
Subscribe to:
Posts (Atom)